273. GCP搞openTelemetry筆記
WHY
要開始弄Google Manage Prometheus後面簡稱GMP,
要用GMP的話,蒐集metric可以用Google的套件,
也可以用OpenTelemetry ,
因為OpenTelemetry後面簡稱Otel ,可以適用於未來還要弄的trace,
早晚都要會的,那不如就一次硬上吧。
Note
先看GCP的文件- OpenTelemetry 收集器使用入門
基本可分成幾個步驟
1. 實作workload Identity;建立一個ServiceAccount授予monitoring.metricWriter的權限,並且綁在namespace的default上面。
kubectl create ns otel \
&&
gcloud config set project <project> \
&&
gcloud iam service-accounts create gmp-test-sa \
&&
gcloud iam service-accounts add-iam-policy-binding \
  --role roles/iam.workloadIdentityUser \
  --member "serviceAccount:<project>.svc.id.goog[otel/default]" \
  gmp-test-sa@<project>.iam.gserviceaccount.com \
&&
kubectl annotate serviceaccount \
  --namespace otel \
  default \
  iam.gke.io/gcp-service-account=gmp-test-sa@<project>.iam.gserviceaccount.com \
&&
gcloud projects add-iam-policy-binding <project>\
  --member=serviceAccount:gmp-test-sa@<project>.iam.gserviceaccount.com \
  --role=roles/monitoring.metricWriter
2. 設定Otel
GCP文件先寫config,也不是不可以。
但我建議直接先上deploy跟設定吧。
下方有簡單的說明config設定及修改過的地方。
apiVersion: rbac.authorization.k8s.io/v1
kind: ClusterRole
metadata:
  name: otel:prometheus-test
rules:
- apiGroups: [""]
  resources:
  - pods
  verbs: ["get", "list", "watch"]
---
apiVersion: rbac.authorization.k8s.io/v1
kind: ClusterRoleBinding
metadata:
  name: otel:prometheus-test
roleRef:
  apiGroup: rbac.authorization.k8s.io
  kind: ClusterRole
  name: otel:prometheus-test
subjects:
- kind: ServiceAccount
  namespace: otel
  name: default
---
apiVersion: apps/v1
kind: Deployment
metadata:
  name: otel-collector
  namespace: otel
spec:
  replicas: 1
  selector:
    matchLabels:
      app: otel-collector
      app.kubernetes.io/name: otel-collector
  template:
    metadata:
      labels:
        app: otel-collector
        app.kubernetes.io/name: otel-collector
      annotations:
        prometheus.io/port: "8888"
    spec:
      containers:
      - name: otel-collector
        image: otel/opentelemetry-collector-contrib:0.120.0
        ports:
            - name: metrics
              containerPort: 8888
              protocol: TCP
            - name: otlp
              containerPort: 4317
              protocol: TCP
            - name: otlp-http
              containerPort: 4318
              protocol: TCP
        args:
        - --config
        - /etc/otel/config.yaml
        - --feature-gates=exporter.googlemanagedprometheus.intToDouble
        volumeMounts:
        - mountPath: /etc/otel/
          name: otel-config
      volumes:
      - name: otel-config
        configMap:
          name: otel-config
---
apiVersion: v1
kind: Service
metadata:
  name: otel-collector
  namespace: otel
spec:
  selector:
    app: otel-collector
  ports:
    - protocol: TCP
      port: 8888
      targetPort: 8888
      name: metrics
---
kind: ConfigMap
apiVersion: v1
metadata:
  name: otel-config
  namespace: otel
data:
  config.yaml: |-
    receivers:
      prometheus:
        config:
          scrape_configs:
          - job_name: 'otel_k8s'
            kubernetes_sd_configs:
            - role: pod
            relabel_configs:
            - source_labels: [__meta_kubernetes_pod_label_app_kubernetes_io_name]
              action: keep
              regex: (prom-example|kube-state-metrics|otel-collector)
            - source_labels: [__meta_kubernetes_pod_annotation_prometheus_io_path]
              action: replace
              target_label: __metrics_path__
              regex: (.+)
            - source_labels: [__address__, __meta_kubernetes_pod_annotation_prometheus_io_port]
              action: replace
              regex: (.+):(?:\d+);(\d+)
              replacement: $$1:$$2
              target_label: __address__
            - action: labelmap
              regex: __meta_kubernetes_pod_label_(.+)

    processors:
      resourcedetection:
        detectors: [gcp]
        timeout: 10s

      transform:
        # "location", "cluster", "namespace", "job", "instance", and "project_id" are reserved, and
        # metrics containing these labels will be rejected.  Prefix them with exported_ to prevent this.
        metric_statements:
        - context: datapoint
          statements:
          - set(attributes["exported_location"], attributes["location"])
          - delete_key(attributes, "location")
          - set(attributes["exported_cluster"], attributes["cluster"])
          - delete_key(attributes, "cluster")
          - set(attributes["exported_namespace"], attributes["namespace"])
          - delete_key(attributes, "namespace")
          - set(attributes["exported_job"], attributes["job"])
          - delete_key(attributes, "job")
          - set(attributes["exported_instance"], attributes["instance"])
          - delete_key(attributes, "instance")
          - set(attributes["exported_project_id"], attributes["project_id"])
          - delete_key(attributes, "project_id")

      batch:
        # batch metrics before sending to reduce API usage
        send_batch_max_size: 200
        send_batch_size: 200
        timeout: 5s

      memory_limiter:
        # drop metrics if memory usage gets too high
        check_interval: 1s
        limit_percentage: 65
        spike_limit_percentage: 20

    # Note that the googlemanagedprometheus exporter block is intentionally blank
    exporters:
      googlemanagedprometheus:

    service:
      # 抓log失敗原因
      # telemetry:
      #     logs:
      #         level: DEBUG
      pipelines:
        metrics:
          receivers: [prometheus]
          processors: [batch, memory_limiter, resourcedetection, transform]
          exporters: [googlemanagedprometheus]

      telemetry:
        metrics:
          level: detailed
          readers:
            - pull:
                exporter:
                  prometheus:
                    host: "0.0.0.0"
                    port: 8888
a. deployment設定
annotations中 prometheus.io/port: "8888" ,
是由於要抓取otel的metrics,所以特別指定的擷取metrics port,
不然prometheus預設擷取第一個port 4317。
b. config設定
relabel_configs的source_labels __meta_kubernetes_pod_label_app_kubernetes_io_name,
這邊指定要抓的metrics,需額外裝kube-state-metrics。
prom-example是prometheus的範例檔,用此命令部屬
kubectl -n otel apply -f https://raw.githubusercontent.com/GoogleCloudPlatform/prometheus-engine/v0.13.0/examples/example-app.yaml
收集器開啟LOG紀錄(除錯)
service:
    telemetry:
        logs:
            level: DEBUG
ref. Failed to scrape Prometheus endpoint
打開otel的port 8888 ,為了接收到metrics。
      telemetry:
        metrics:
          level: detailed
          readers:
            - pull:
                exporter:
                  prometheus:
                    host: "0.0.0.0"
                    port: 8888
otel的 config基本架構如下。
| 設定 | 作用 |
|---|---|
receivers |
接收數據(Prometheus, OTLP, KubeletStats 等) |
processors |
處理數據(批量處理、轉換、過濾) |
exporters |
發送數據到不同後端(Prometheus, Loki, OTLP) |
service.pipelines |
定義數據流向(決定哪些數據要送到哪些地方) |
-
receivers(接收器)
作用:負責接收來自不同來源的數據,例如指標 (metrics)、日誌 (logs)、追蹤 (traces)。
ref. Receivers -
processors(處理器)
對數據進行處理,如過濾、增強、聚合。
ref.processors -
exporters(導出器)
作用:將數據導出到指定後端,例如 Prometheus、Loki、OTLP 服務等。
ref. exporters -
service(管道組合)
作用:定義不同類型的數據應該如何流動,設定接收器、處理器、導出器的組合方式。
ref.service
p.s. 附上Otel demo的yaml,有一些基本的設定可以在這參考。
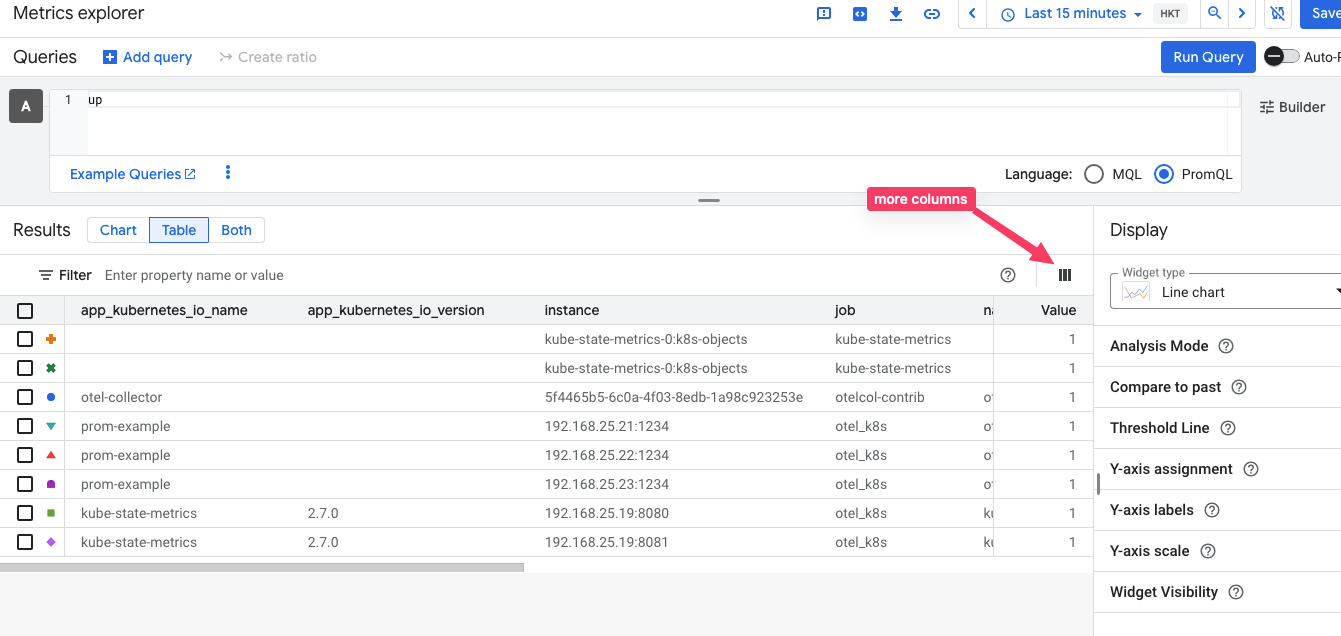
3. 驗證Otel資料
確認Otel-collector沒有錯誤。
在 cloud Metrics Exporer輸入 up 沒看到目標叢集
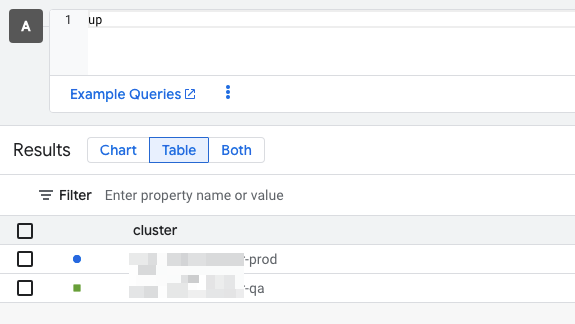
打開 cluster,將Cloud Monitoring的選項打開,只設定system。
之後就會看到對應的metrics
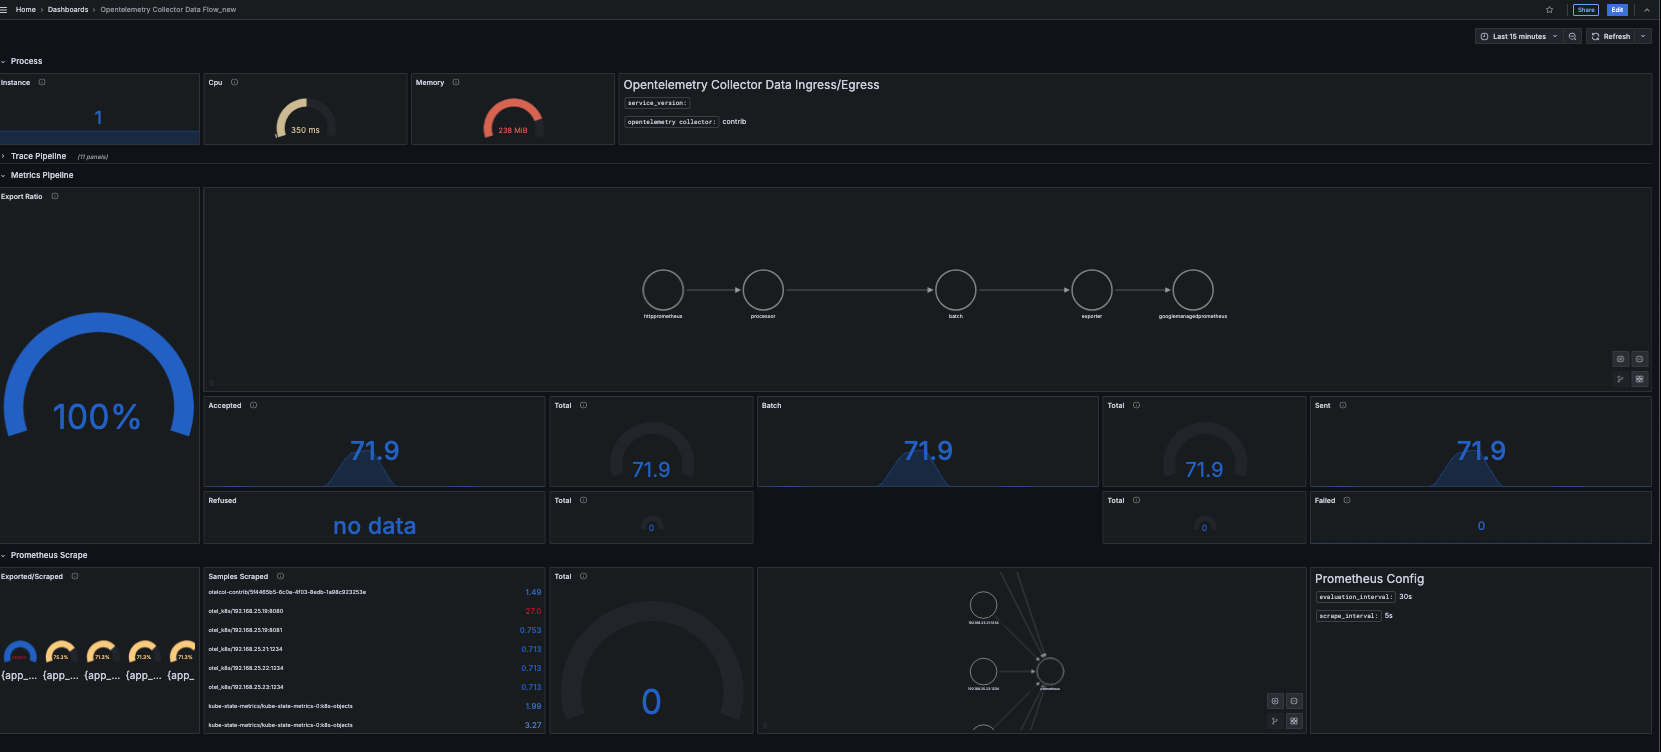
4. 用Grafana查看GMP
這不算是Otel的相關流程,
但追根究底,用了Otel統整資料,最後還是要給Grafana使用。
使用Grafana查詢GMP的方法,文件-使用 Grafana 進行查詢
Otel 的grafana流程圖說明,Grafana dashboard可至
grafana dashboard下載。
在2025/03/20時,我使用上面的dashboard,預設有很多chart是錯誤的,
追查是因為很多metrics的名稱被改掉,
otelcol_receiver_accepted_spans被改成otelcol_receiver_accepted_metric_points_totalotelcol_receiver_refused_spans改otelcol_receiver_refused_metric_points_totalotelcol_receiver_accepted_metric_points改otelcol_receiver_accepted_metric_points_total
..
類似的還有不少,當有錯誤時,可以確認一下內容。
上面都是我搜尋otel metrics猜的metrics,
也不知道是不是正確,但看起來很像一回事。
題外話
利用GPT問答時,
也有看到另一種架構,
當receivers過多時,在DaemonSet建立Otel-collector,
再匯入到一個Otel ,之後再由這個Otel決定要到哪個Exporter。